
Bitcoin’s $123K Weekly Close did not only break records, it rewrote the rules of price discovery. Bitcoin comfortably settled above $123,000—and it showed that buyers have absorbed all the pumps and are now taking the market into unseen territory. Here, deep-pocketed players earnestly withdraw coins from exchanges while futures traders lean toward long positions with unprecedented conviction. Coupled with on-chain metrics indicating strong demand, this weekly milestone signifies that the increase still has plenty of runway before any serious pull back.
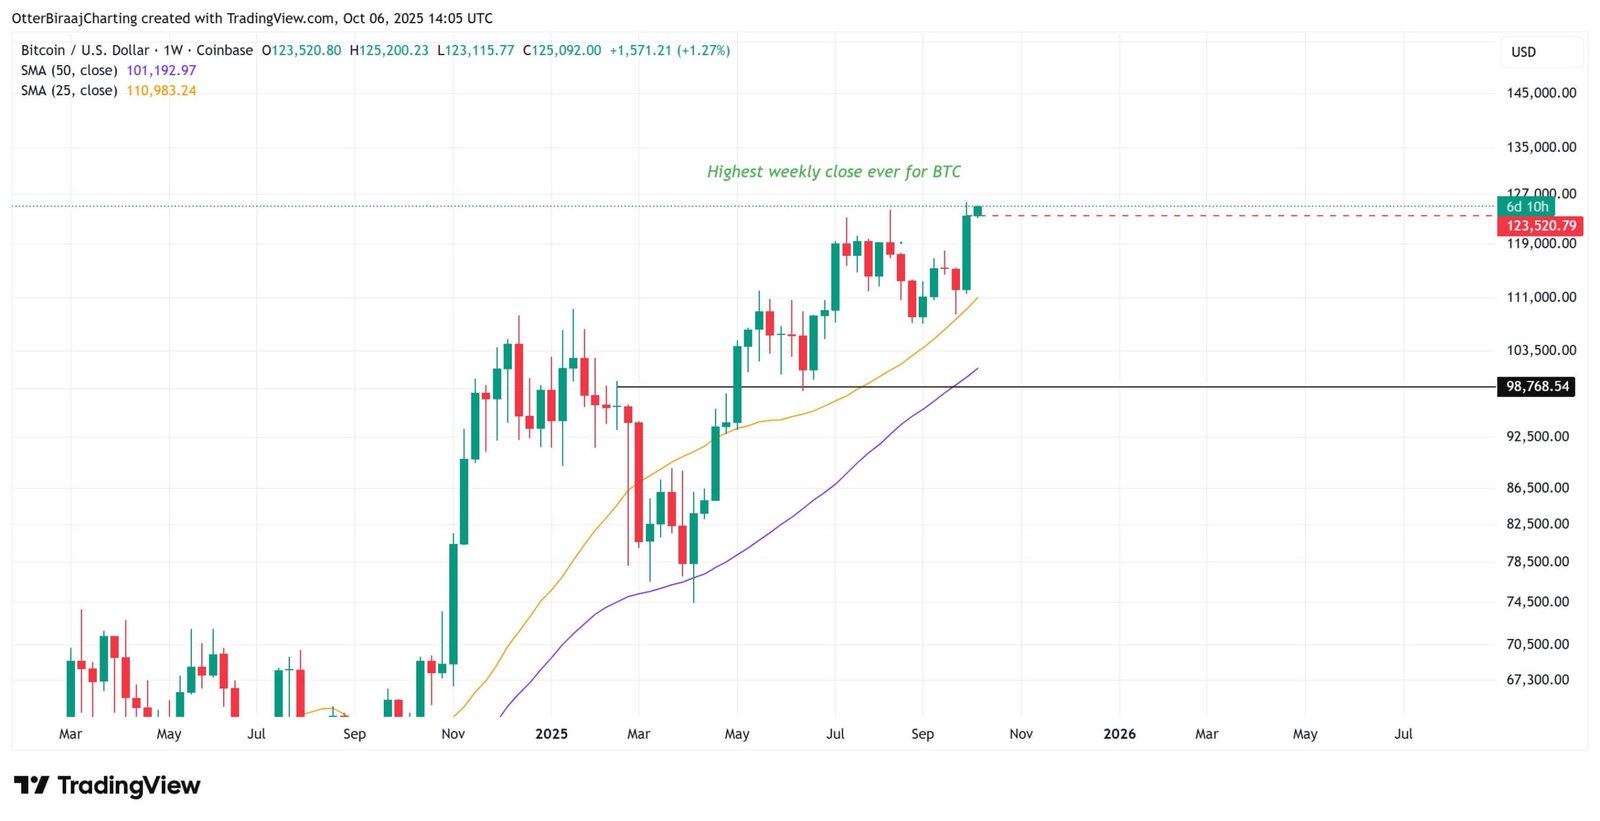
- Bitcoin’s price discovery achieved its highest weekly closing of $123,400.
- Onchain measures and futures data suggest continued bullish control over $122,000.
- The short-term prognosis is divided between a momentum grind upward and a mean reversion fall.
Bitcoin’s $123K Weekly Close:
Bitcoin closed at $123,500, marking a new era of price discovery. As it consolidated around its all-time high (ATH) of $125,800, three important onchain and derivative measures demonstrated the health and longevity of the bullish trend.
Other features of the Bitcoin landscape are also positive, as can be seen in the fundamentals (including on-chain data and derivatives). Firstly, exchange net flows have been definitively negative, that is, clearly there is more BTC being taken off exchanges than put onto exchanges, which is indicative of holders who do not want to be selling BTC, who are wanting either to accumulate or coldstore coins.
Secondly, the open interest in BTC futures has also reached record levels in a situation with increased funding rates. A high level of open interest indicates that either institutional or retail traders have committed more capital at risk, whilst the higher funding rates are indicative of a bullish bias in the market. Traders are having to pay to maintain long positions.
Thirdly, realized cap (ie, the total cost-basis of all coins) has also increased, which is indicative of an increased supply than last changed hands at radically higher levels. Where market cap is considerably in excess of realized cap, as at present, this is indicative of a high level of confidence by investors, following by a willingness to hold through volatility.
Finally, the active addresses metric is on an uptrend, this indicates that there is renewed activity in terms of on-chain involvement, as this week there are more unique wallets that have sent and/or received BTC than at previous periods of consolidation. Taken together these factors of exchange outflows, high future open interest and funding, increased realized cap and increases in address activity, paint a picture of improving confidence and demand, suggesting that the rally in BTC still has some distance to run.
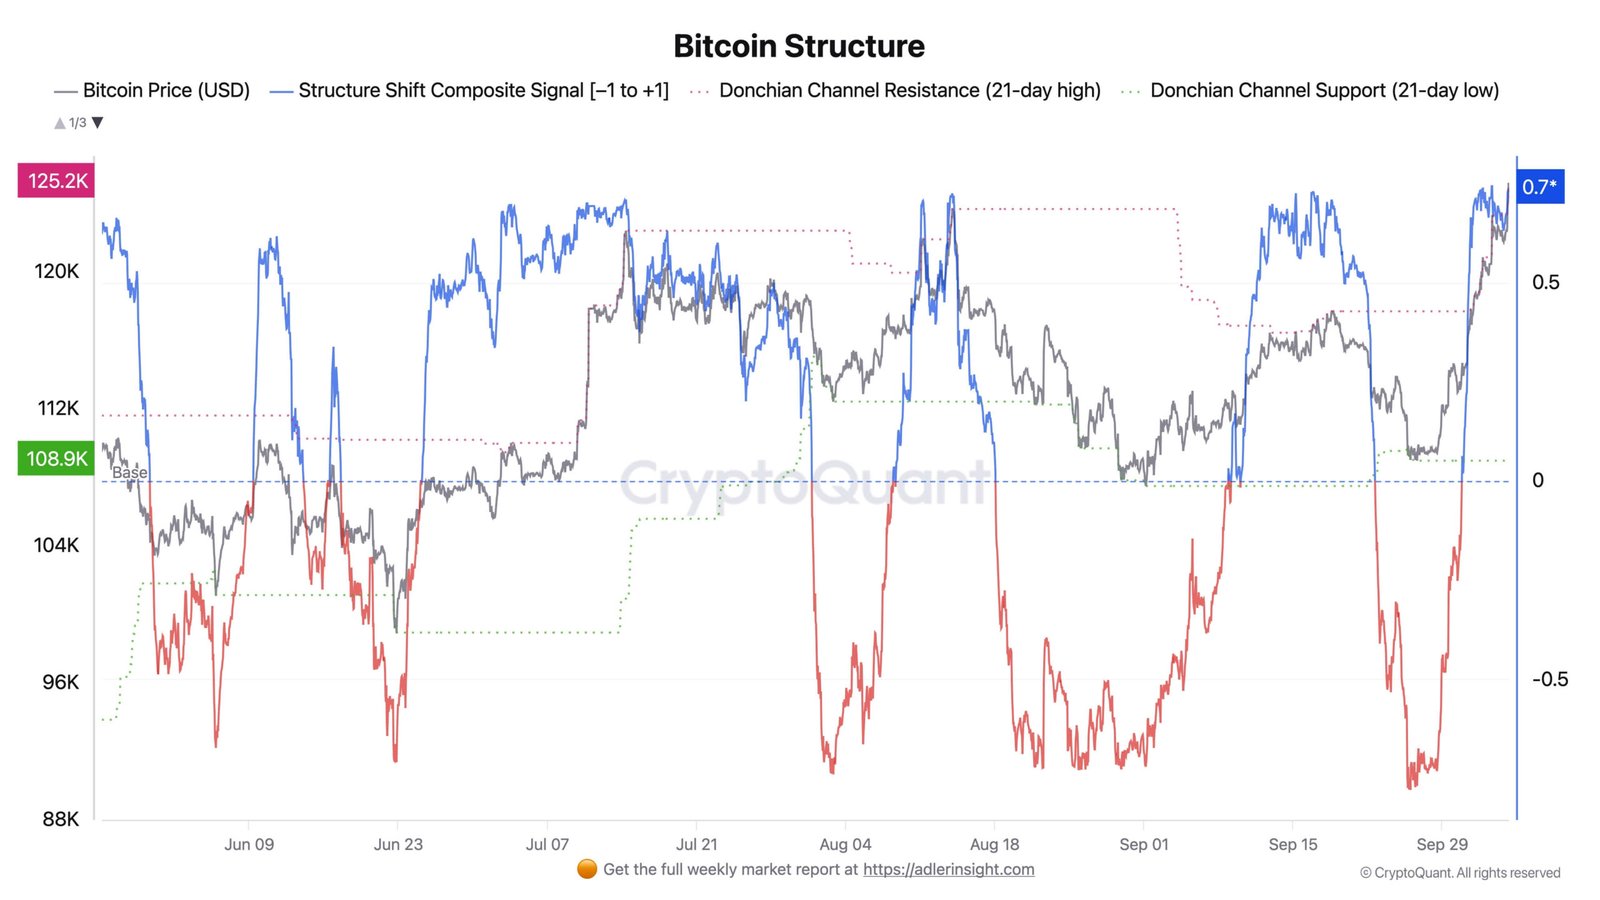
Bulls control Bitcoin’s structural momentum around $123,000.
Bitcoin’s structural momentum remains very positive. Bitcoin expert Axel Adler Jr. observed that BTC’s price remained strained against the top limit of the 21-day “Donchian” channel ($125,200). At the same time, the structural shift composite remains high at +0.73, indicating buyer dominance and controlled pullbacks. The current debate over the $125,000 ATH may decide whether the market continues upward or stops for consolidation.
Also, when you zoom out on the larger Bitcoin charts, you can see this structure looks almost like they are waving banners, not just flashing green. The Donchian channel squeeze up near the top of its channel indicates ongoing buying pressure, as if traders were lining up to get in instead of scrambling to get out. In addition, this +0.73 reading on the structural shift composite is no invrio velvet punch oscillator. It is an identifiable reflection of a change in market psychology. Buyers are stepping in on dips with conviction, treating shallow pullbacks as entry points and not warning signs.
Adding to this is the growing number of whales and institutions holding things through this stretch of time, as it is easy to see why sideways churn near $125K looks like digging more than where they peak out. If sellers wanted to snuff this rally, it would take overwhelming a well entrenched bullish base, hard to imagine given the on-chain demand and derivative flow coordination. The focus will be on if the $125,000 break is for real, as good technical breakouts might turn this consolidation to be springboarded to new highs.
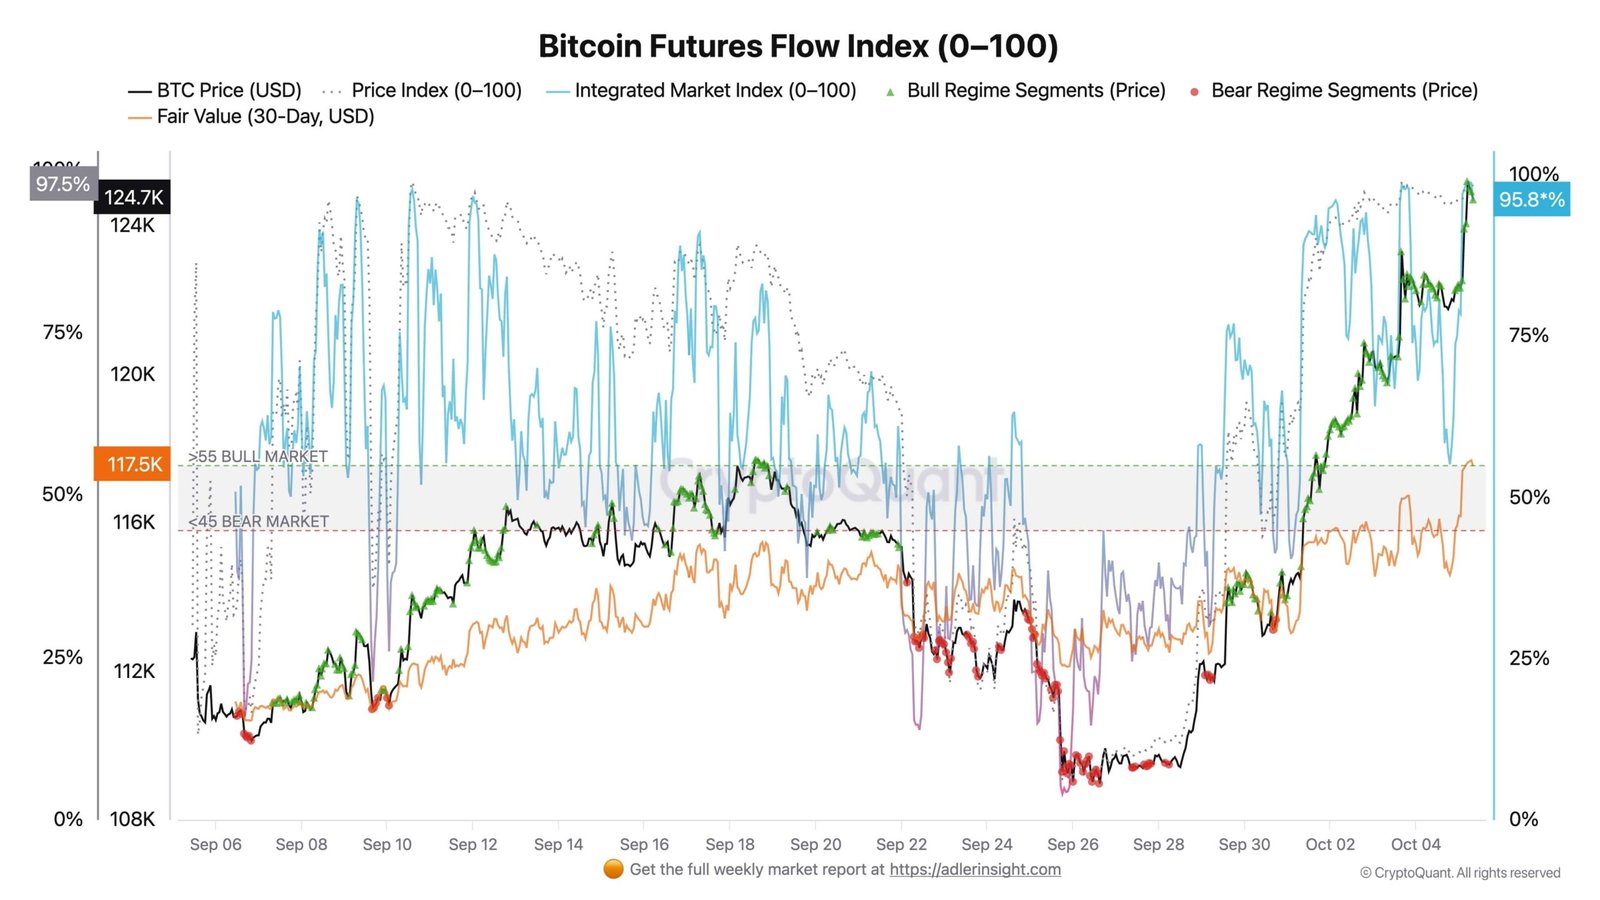
Futures flow indicator indicates bullish pressure.
The Bitcoin futures flow index is at 96%, with the price far above its 30-day fair value of $117,500, indicating a typical “bullish mode” indication. This setup often follows a short cooling or digesting phase in which hot futures activity stabilises before continuing.
Finally, the Profit/Loss Block score stayed at a maximum of +3, indicating that the majority of UTXOs are profitable, implying a high risk appetite and continuous dip-buying behaviour.
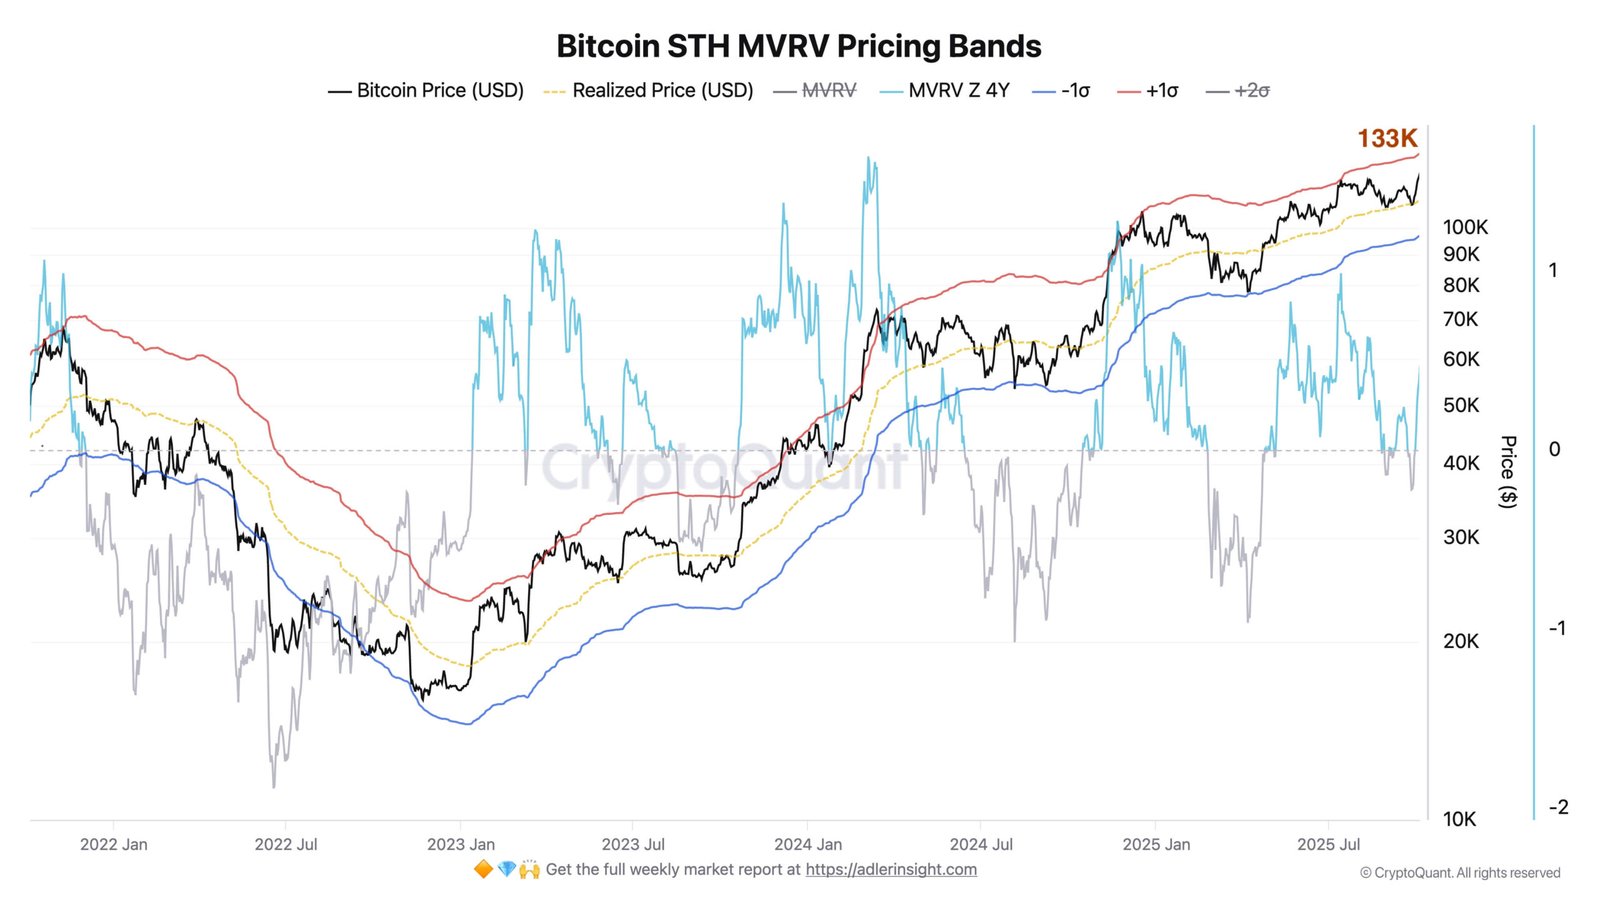
Meanwhile, the short-term holding MVRV ratio is approaching the +1 zone at $133,000, indicating possible resistance as profit-taking pressure grows. Maintaining P/L momentum above the 90th percentile is critical to avoiding divergence and trend fatigue.
Short-term outlook: A momentum grind or a mean reversion for Bitcoin?
Bitcoin’s short-term structure revealed two separate continuation prospects after its record weekly closing over $123,000.
The first scenario predicted a momentum-based breakout in which “high prices stay higher.” In this instance, Bitcoin may consolidate inside a limited range of $122,000 to $124,000, building a high-timeframe base as volatility declines.
Such behaviour usually precedes modest trend expansion, enabling the market to prolong its price discovery period with a sluggish grind to new highs. Sustained high positioning would indicate that this pattern is a bullish continuation rather than a distribution.
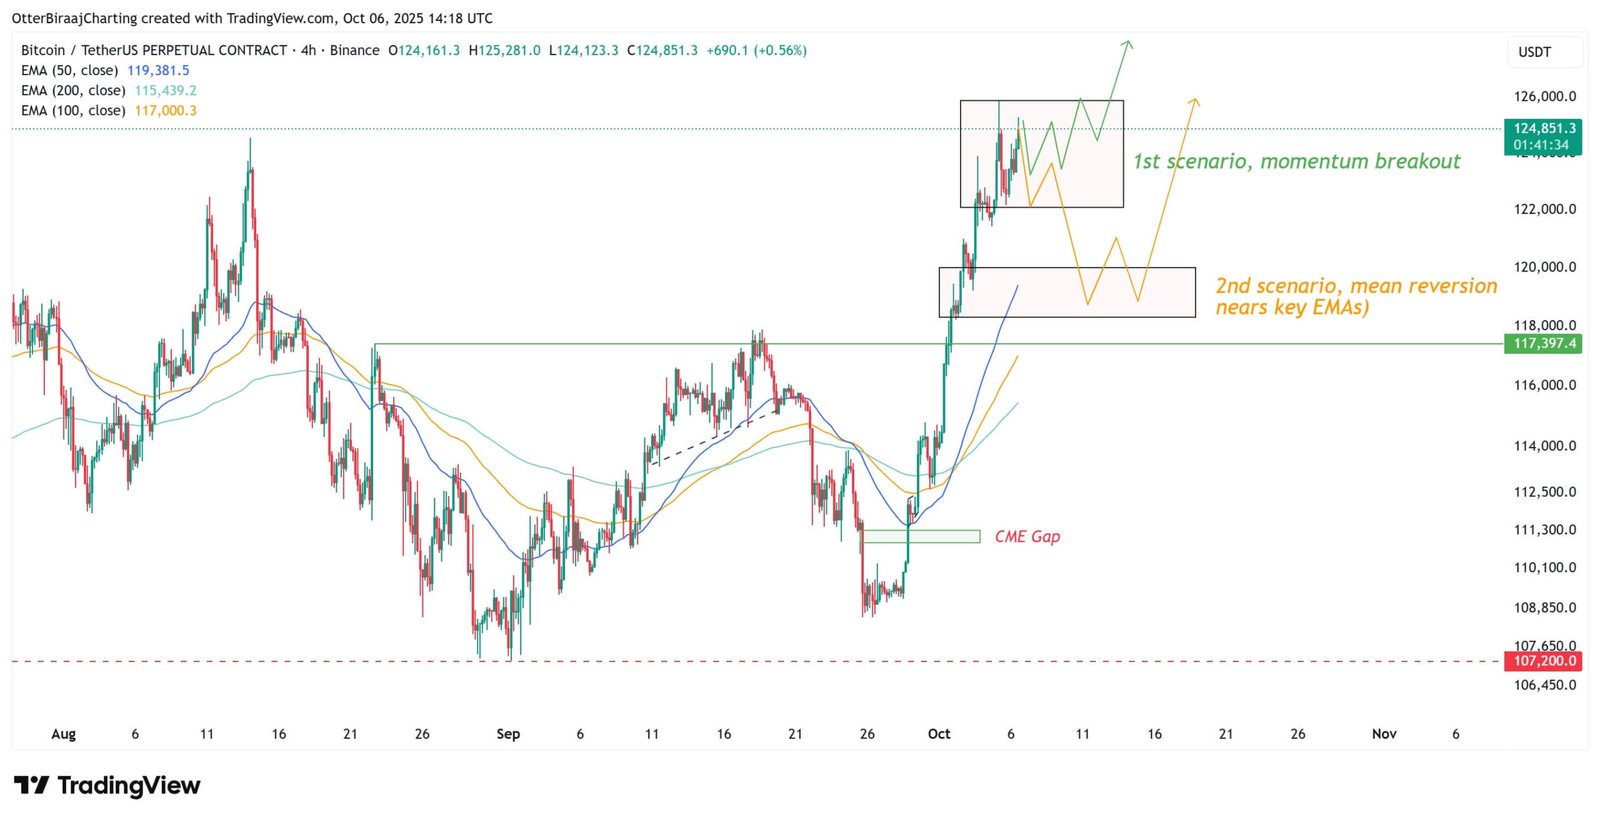
Alternatively, a mean reversion configuration remained possible. This would entail a corrective retest of major moving averages on the four-hour chart, namely the 50-, 100-, and 200-period exponential moving averages (EMAs), which would correspond to a liquidity pocket ranging from $118,500 to $120,000.
A retreat into this zone would reset short-term leverage, re-establish demand, and preserve structural integrity as long as $118,000 is maintained as upper support.
Overall, the present market balance indicated a consolidation of bullish vigour. Whether via continuous compression or a temporary liquidity sweep, the overall trend bias stayed higher till momentum weakened below the mid-$118,000 level.
▾ ARTICLE SOURCES
We cite primary sources where possible and reputable publishers for context.
⚠️ Disclosure